Ants
The following example is using NetLogo Ants model (Wilensky 1997) to show simple parameter sets definition and parameter mapping.
When parameters (param_values) are defined as a list of value vectors, parameter sets are expanded to all possible parameter value combination what is called “full factorial design”. In practice it is feasible with few parameters and small number of factors for each parameter.
The mapping element takes care of mapping between R names and NetLogo variables. NetLogo identifiers may contain any Unicode letter or digit and the following ASCII characters:
.?=*!<>:#+/%$_^'&-
It is not impossible to define such variables and column names in R but using them is somehow inelegant.
experiment <- nl_experiment(
model_file = file.path(nl_netlogo_path(),
"models/Sample Models/Biology/Ants.nlogo"),
iterations = 150,
step_measures = measures(
pile1 = "sum [food] of patches with [pcolor = cyan]",
pile2 = "sum [food] of patches with [pcolor = sky]",
pile3 = "sum [food] of patches with [pcolor = blue]"
),
param_values = list(
population = 125,
diffusion_rate = c(50, 70),
evaporation_rate = c(5, 10, 15)
),
mapping = c(
diffusion_rate = "diffusion-rate",
evaporation_rate = "evaporation-rate"
),
random_seed = 2,
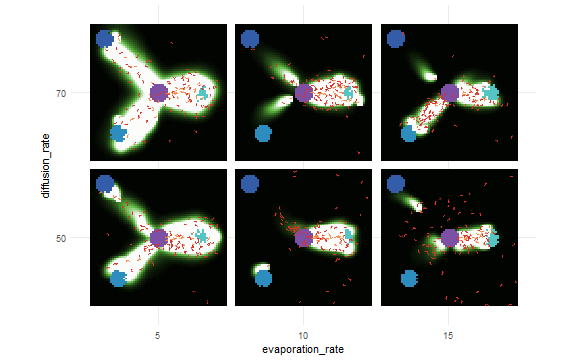
export_view = TRUE
)results <- nl_run(experiment) nl_show_views_grid(results,
x_param = "evaporation_rate",
y_param = "diffusion_rate")
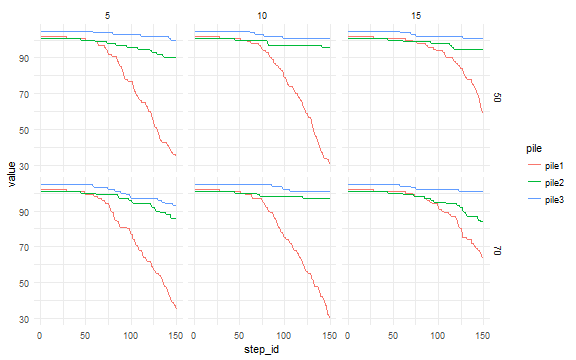
library(tidyr)
dat <- nl_get_step_result(results)
dat <- tidyr::gather(dat, pile, value, pile1, pile2, pile3)library(ggplot2)
ggplot(dat, aes(x = step_id, y = value, color = pile) ) +
geom_line() +
facet_grid(diffusion_rate ~ evaporation_rate) +
theme_minimal()