Best-fit Criterion
This example is using NetLogo Flocking model (Wilensky, 1998) to demonstrate single best-fit criterion evaluation.
Use full factor design experiment as in Categorical Criteria Example:
experiment <- nl_experiment(
  model_file = "models/Sample Models/Biology/Flocking.nlogo",
  setup_commands = c("setup", "repeat 100 [go]"),
  iterations = 5,

  param_values = list(
    world_size = 50,
    population = 80,
    vision = 6,
    min_separation = seq(from = 0, to = 4, by = 0.25),
    max_align_turn = seq(from = 0, to = 20, by = 1.25)
  ),
  mapping = c(
    min_separation = "minimum-separation",
    max_align_turn = "max-align-turn"),

  step_measures = measures(
    converged = "1 -
      (standard-deviation [dx] of turtles +
       standard-deviation [dy] of turtles) / 2",
    mean_crowding =
      "mean [count flockmates + 1] of turtles"
  ),
  eval_criteria = criteria(
    c_converged = mean(step$converged),
    c_mcrowding = mean(step$mean_crowding)
  ),

  repetitions = 10,                        # repeat simulations 10 times
  random_seed = 1:10,

  eval_aggregate_fun = mean                # aggregate over repetitions
)
result <- nl_run(experiment, parallel = TRUE, print_progress = TRUE)Best-fit Criterion Function
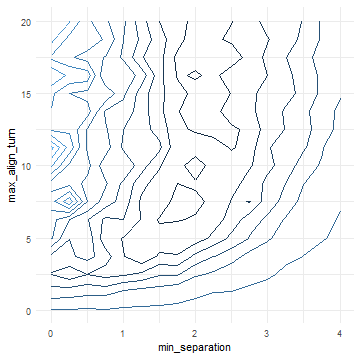
If our ideal mean crowding is around 8 and convergence is near 1 we can construct a function like this:
\[ value = \sqrt{(crowding - 8)^2 + 100 \times (converged - 1)^2} \]
dat <- nl_get_criteria_result(
  result,
  eval_value = sqrt((c_mcrowding - 8)^2 + 400*(c_converged - 1)^2)
)
library(ggplot2)
ggplot(dat,
aes( x = min_separation, y = max_align_turn, fill = eval_value)) +
geom_tile() +
coord_fixed(4/20) +
theme_minimal() +
theme(legend.position="none")library(ggplot2)
ggplot( dat, aes(x = min_separation, y = max_align_turn, z = eval_value) ) +
stat_contour(bins = 11, aes(color = ..level..)) +
coord_fixed(4/20) + theme_minimal() + theme(legend.position="none")