Latin Hypercube Sampling
This example is using NetLogo Flocking model (Wilensky, 1998) to demonstrate exploring parameter space with categorical evaluation and Latin hypercube sampling (LHS).
Like in previous example we are using categorical evaluation criteria but instead of exploring parameter space with (full) factorial design we use Latin hypercube sampling method from lhs package.
experiment <- nl_experiment(
  model_file = "models/Sample Models/Biology/Flocking.nlogo",
  setup_commands = c("setup", "repeat 100 [go]"),
  iterations = 5,

  param_values = nl_param_lhs(
    n = 100,
    world_size = 50,
    population = 80,
    vision = 6,
    min_separation = c(0, 4),
    max_align_turn = c(0, 20)
  ),
  mapping = c(
    min_separation = "minimum-separation",
    max_align_turn = "max-align-turn"),

  step_measures = measures(
    converged = "1 -
      (standard-deviation [dx] of turtles +
       standard-deviation [dy] of turtles) / 2",
    mean_crowding =
      "mean [count flockmates + 1] of turtles"
  ),
  eval_criteria = criteria(
    c_converged = mean(step$converged),
    c_mcrowding = mean(step$mean_crowding)
  ),

  repetitions = 10,                        # repeat simulations 10 times
  random_seed = 1:10,

  eval_aggregate_fun = mean                # aggregate over repetitions
) result <- nl_run(experiment, parallel = TRUE)dat <- nl_get_criteria_result(
result,
are_grouped = c_mcrowding >= 5 & c_mcrowding < 11,
are_aligned = c_converged > 0.7
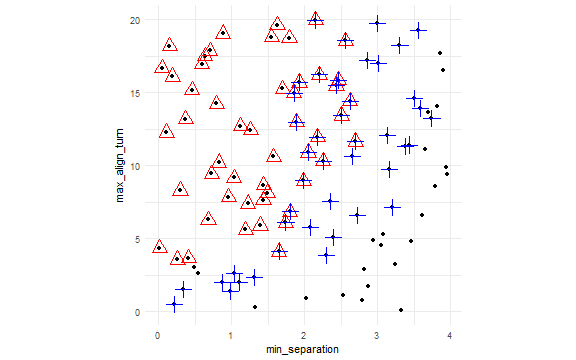
)library(ggplot2)
ggplot( dat, aes(x = min_separation, y = max_align_turn) ) +
geom_point() +
geom_point(data=subset(dat,are_aligned), color="red",size=5,shape=2) +
geom_point(data=subset(dat,are_grouped), color="blue",size=5,shape=3) +
coord_equal(ratio = 1/5) +
theme_minimal()