DLA example
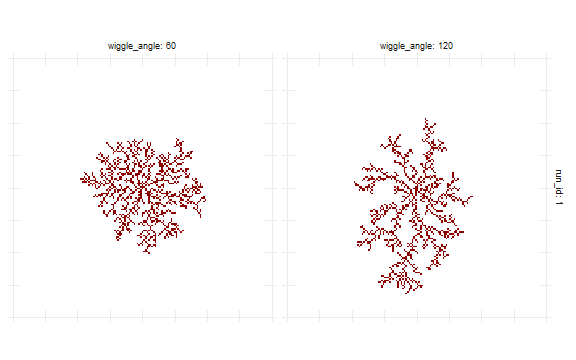
Getting information about patches is analogous to reading agents’ data. Example below defines experiment with patches_after element to access position and color of all patches. Example uses NetLogo diffusion-limited aggregation (DLA) model (Wilensky, 1997).
experiment <- nl_experiment(
  model_file = "models/Sample Models/Chemistry & Physics/Diffusion Limited Aggregation/DLA.nlogo",

  while_condition = "count patches with [pcolor = 55] < 1000",

  param_values = list(
    wiggle_angle = c(60,120),
    `max-particles` = 100,
    `use-whole-world?` = FALSE,
    world_size = 150
  ),
  mapping = c(
    wiggle_angle = "wiggle-angle"
  ),
  patches_after = list(
    patches = patch_set(
      vars = c("pxcor", "pycor", "pcolor"),
      patches = "patches"
    )
  ),
  random_seed = 1
)
result <- nl_run(experiment)library(ggplot2)
nl_show_patches(result, x_param = "wiggle_angle") +
scale_fill_manual(values = c("white","darkred"))
See also
Ants example demonstrates simple parameter sets definition and parameter mapping.